Ecology
How does the reckless use of resources affect our planet?
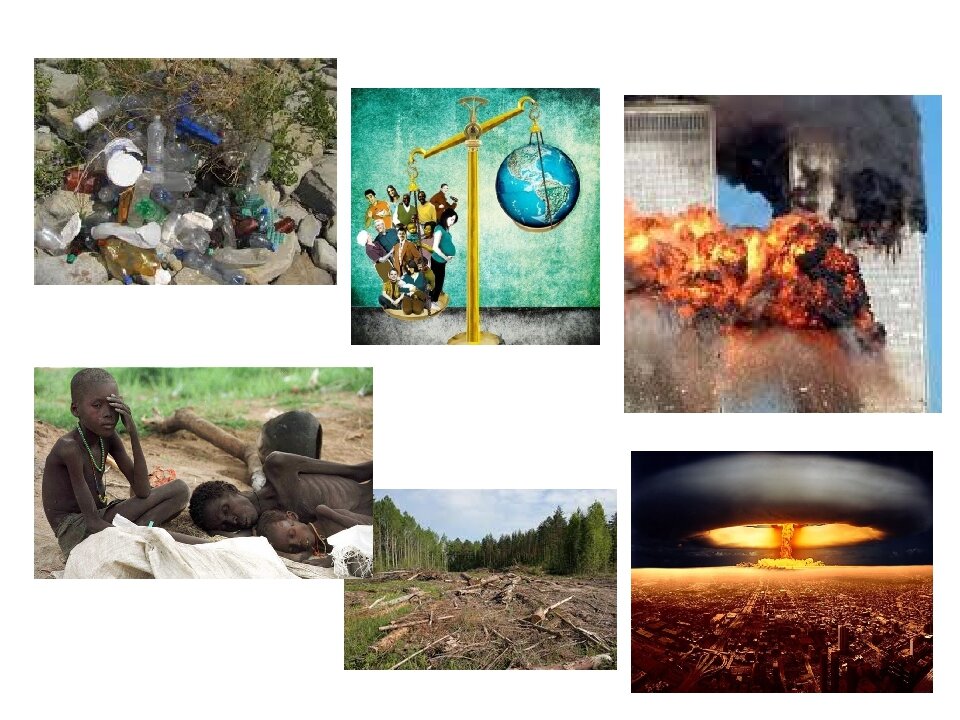
Planetary Ecological Threats
The planet is facing unprecedented pressure caused by human activity, manifested in accelerating climate change, catastrophic biodiversity loss, and widespread pollution. Despite individual successes, the overall trajectory points toward approaching tipping points.
Alarming Trends
Climate Change and Warming
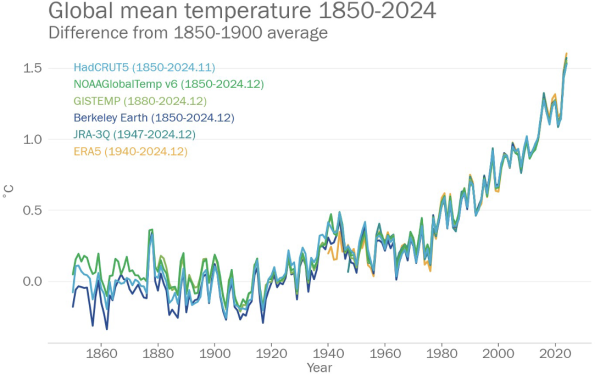
Temperature Records and Trends
2024 officially became the hottest year in recorded history, with global average temperature reaching 1.55°C above pre-industrial levels (1850-1900), according to the World Meteorological Organization WMO confirms 2024 as warmest year on record at about 1.55°C above pre-industrial level. This figure closely approached the critical threshold of 1.5°C established by the Paris Agreement as the maximum allowable warming level. The last decade (2015-2024) has been recognized as the hottest in the entire history of instrumental measurements that began in 1880. Of particular concern is the rate of human-caused warming, which reached an unprecedented level of 0.27°C per decade during 2015-2024 Indicators of Global Climate Change 2024. Such rates of change significantly exceed the ability of many ecosystems and species to adapt to new conditions.
Greenhouse Gas Concentrations
In May 2025, atmospheric carbon dioxide (CO₂) concentration exceeded 430 parts per million (ppm) for the first time in recorded history, reaching 430.2-430.5 ppm according to measurements at the Mauna Loa Observatory. This figure is 3.5-3.6 ppm higher than in May 2024, demonstrating a steady growth trend, and exceeds pre-industrial levels of around 280 ppm by more than 50% Annual Carbon Dioxide Peak Passes Another Milestone. Such atmospheric CO₂ concentrations were last observed about 3-5 million years ago during the Pliocene epoch, when sea levels were 15-25 meters higher than today and global temperature was 2-3°C higher. According to Global Carbon Budget project estimates, if current CO₂ emission rates continue at around 37 gigatons per year, the remaining carbon budget to keep warming within the critical threshold of 1.5°C will be completely exhausted within the next three years Global Carbon Budget.
Forecasts and Risks
The World Meteorological Organization predicts with 86% probability that at least one year between 2025 and 2029 will exceed the critical warming threshold of 1.5°C WMO Global Annual to Decadal Climate Update. This means a high probability of temporarily exceeding Paris Agreement targets within the coming years. Climate scientists warn of rapid approach to climate “tipping points,” including mass coral bleaching and extinction, Amazon rainforest collapse, permafrost melting with methane release, West Antarctic Ice Sheet destabilization, and Atlantic thermohaline circulation slowdown. Activation of these processes will have cascading and virtually irreversible consequences for the entire planet’s climate system, potentially leading to self-reinforcing warming.
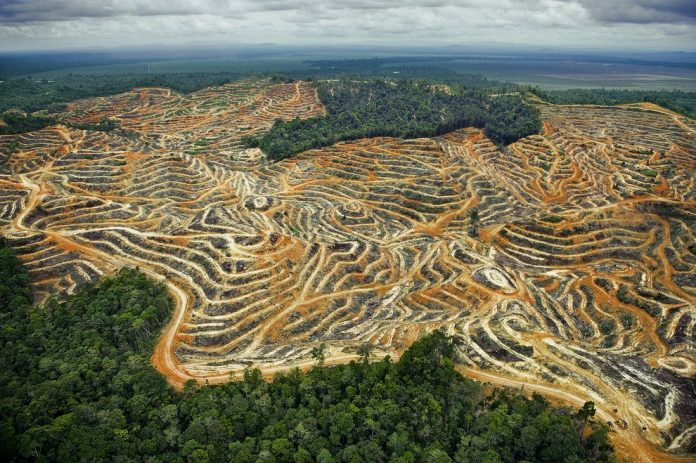
Deforestation and Forest Ecosystem Degradation
Catastrophic Tropical Forest Losses
In 2024, the world lost a record 6.7 million hectares of primary tropical forests—an area comparable to Panama or Ireland. This is the worst figure in two decades of observations, with a loss rate equivalent to 18 football fields disappearing every minute, nearly double the catastrophic level of 2023 Fires Drove Record-breaking Tropical Forest Loss in 2024. Primary tropical forests are particularly valuable because they store enormous carbon reserves, support the highest biodiversity, and play a key role in global climate regulation through moisture evaporation and cloud formation. Their loss is irreplaceable on human timescales, as mature tropical forest ecosystems require centuries to form.
Fires as the Primary Cause
For the first time in over 20 years of systematic observations, fires became the main cause of primary tropical forest destruction, surpassing traditionally dominant agriculture and cattle ranching. In 2024, fire destroyed five times more tropical forests compared to the previous year, largely due to record hot and dry conditions created and exacerbated by anthropogenic climate change Tropical forest loss hit new heights in 2024; fire a major driver in Latin America. Forest fires in the tropics are particularly destructive because these ecosystems have not evolutionarily adapted to fire, unlike some temperate and northern forests. Additionally, tropical forest fires release enormous amounts of stored carbon into the atmosphere, turning forests from CO₂ sinks into sources.
Regional Dynamics
Brazil continues to sadly lead in absolute forest cover loss, accounting for 42% of all primary tropical forest losses worldwide, approximately 2.8 million hectares. However, positive changes should be noted: thanks to efforts by Lula da Silva’s government and strengthened conservation policies, the Brazilian Amazon showed a significant 30.6% decrease in deforestation rates in 2024 In one year, deforestation and conversion falls 30.6% in the Amazon. Indonesia and Malaysia also demonstrate encouraging trends, with primary forest loss declining by 14% and 12% respectively, resulting from logging moratoriums and sustainable forest management programs Indonesia’s Primary Forest Loss slows in 2024. Nevertheless, global loss of all tree cover in 2024 reached a catastrophic 30 million hectares, the highest figure since satellite monitoring began in 2001.
Ocean and Marine Ecosystem Pollution
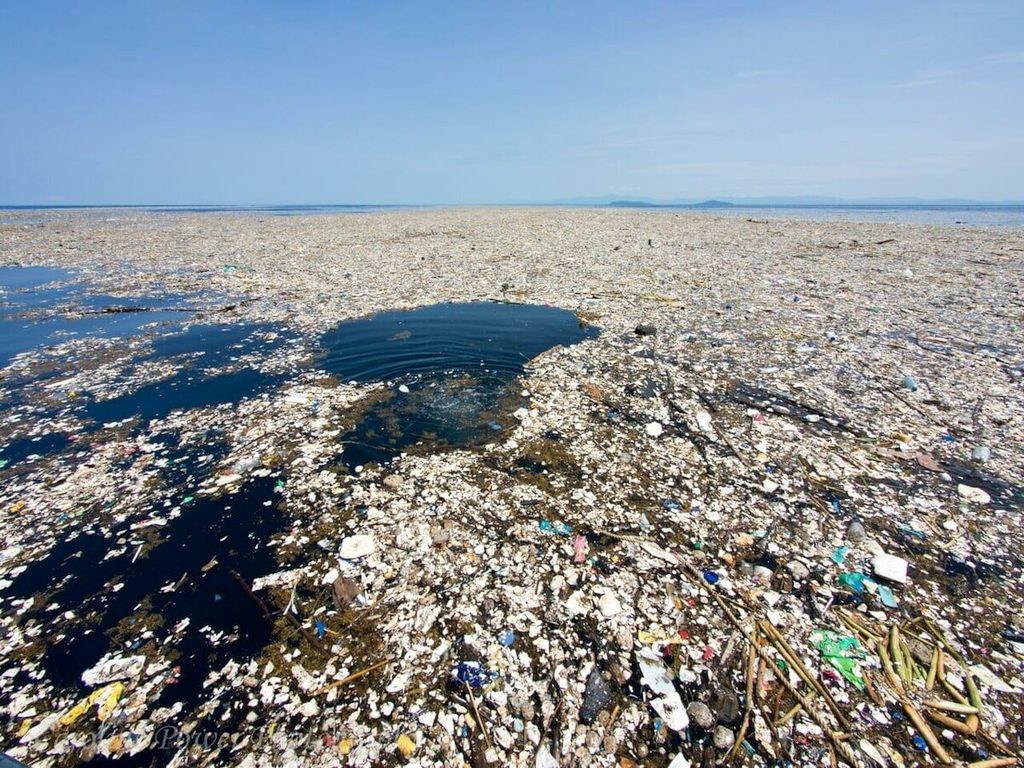
Scale of Plastic Pollution
According to the most conservative estimates for 2025, 75 to 199 million tons of plastic waste have accumulated in the world’s oceans—a mass comparable to the weight of all marine mammals on the planet. Annually, about 15 million tons (33 billion pounds) of new plastic enters the marine environment, equivalent to dumping one garbage truck of plastic waste into the ocean every minute 100+ Plastic in the Ocean Statistics & Facts 2025. This means approximately 21,000 pieces of plastic debris in the ocean for every person on the planet. Plastic waste concentrates in five major oceanic gyres, forming giant “garbage patches,” the largest of which—the Great Pacific Garbage Patch—exceeds France’s territory in area.
Microplastics in Water Column
Modern research confirms the alarming presence of microplastics (particles sized from 1 micrometer to 5 millimeters) at all studied depths of the world’s oceans, from surface waters to the deepest points, including the Mariana Trench. Microplastic concentration varies widely from 10⁻⁴ to 10⁴ particles per cubic meter of water, depending on proximity to pollution sources and ocean currents. Particularly alarming is the fact that with increasing depth, the proportion of microplastics in the total organic carbon composition increases, reaching 5% at 2000-meter depth. Microplastics are found not only in water but also in marine sediments, tissues of marine organisms at all food chain levels from plankton to large predators, and in sea salt consumed by humans.
Impact on Marine Life
Plastic pollution has devastating effects on marine ecosystems, affecting more than 800 species of marine organisms through various mechanisms. About 40% of all marine mammal species and 44% of seabird species regularly suffer from plastic fragment ingestion, mistaking them for food. Large plastic pieces can cause mechanical damage to the digestive tract, intestinal blockage, and false satiation leading to starvation. According to UN Sustainable Development Program data, up to 1 million seabirds and about 100,000 marine mammals die annually from direct and indirect consequences of plastic pollution Goal 14: Conserve and sustainably use the oceans, seas and marine resources for sustainable development. Additionally, plastic pollutants serve as vectors for transporting toxic chemicals and invasive species across ocean basins, disrupting natural ecological balances.
Species Extinction and Biodiversity Loss
Catastrophic Wildlife Population Decline
According to the fundamental World Wildlife Fund report “Living Planet 2024,” one of the most authoritative global studies on biodiversity status, wildlife populations have declined by an average of 73% over the past 50 years (1970-2020). The analysis is based on data from nearly 35,000 populations of over 5,000 vertebrate species, including mammals, birds, fish, reptiles, and amphibians Living Planet Report 2024. These figures indicate that current biodiversity loss rates are 100-1000 times higher than natural background extinction rates, allowing scientists to speak of the onset of the sixth mass extinction in Earth’s history—the first caused by the activity of a single biological species.
Regional Differences
Geographical analysis of biodiversity losses reveals extremely uneven damage distribution. The most dramatic and catastrophic wildlife decline is observed in Latin America and the Caribbean, where losses reached a staggering 95%—meaning less than 5% of original animal populations remain. In Africa, this figure is 76%, also representing an ecological catastrophe of continental scale, while in the Asia-Pacific region it’s 60%. Freshwater ecosystems proved most vulnerable: populations of species living in rivers, lakes, and wetlands declined by an average of 85% Living Planet Report 2024. Such differences relate to the intensity of anthropogenic activity, economic development rates, and conservation measure effectiveness in different world regions.
Threatened Species Status
The International Union for Conservation of Nature (IUCN) Red List of Threatened Species, the gold standard for extinction risk assessment, currently includes status evaluations for 169,420 biological species. Of these, 47,187 species are officially classified as being under various degrees of extinction threat, comprising 28% of all assessed species IUCN Red List of Threatened Species Summary Statistics. The most critically vulnerable groups are amphibians, with 41% of all species under extinction threat due to their particular sensitivity to water pollution, climate change, and fungal diseases. Sharks and rays show 37% threat levels due to overfishing and habitat destruction, while reef-building corals are in crisis with 44% of species threatened with complete extinction due to ocean acidification and rising water temperatures.
Air and Soil Pollution
Global Air Pollution
According to a comprehensive 2024 report by international organization IQAir, based on data from over 30,000 monitoring stations worldwide, only seven countries met strict World Health Organization air quality standards for dangerous fine particulate matter PM2.5 (maximum 5 micrograms per cubic meter). This means 99% of the planet’s population—about 8 billion people—breathe air daily that doesn’t meet international health safety standards. Air pollution from particulate matter, nitrogen oxides, sulfur dioxide, and ozone has become the second leading cause of death worldwide after high blood pressure, claiming 8.1 million lives in 2021 and reducing average global life expectancy by 2.3 years State of Global Air 2024 Report.
Soil Degradation
The planet’s soil resources are experiencing a profound crisis: about one-third of all soils on Earth are in various stages of degradation, with over 40% of degraded lands concentrated in Africa, exacerbating the continent’s food security. Processes of erosion, salinization, chemical contamination, and organic matter depletion result in the world permanently losing 75 billion tons of fertile soil annually—a layer that took nature millennia to form. Economic damage from soil degradation is estimated at a colossal $400 billion USD annually, exceeding the GDP of many developed countries. International organization experts warn that maintaining current trends could result in up to 95% of all arable land resources being degraded by 2050 Soil Atlas.
Desertification
Anthropogenic land degradation processes have acquired global character, affecting at least 1.6 billion hectares of productive land worldwide—territory comparable to Russia’s area. This ecological catastrophe directly affects the lives and livelihoods of 3.2 billion people, especially in developing countries where populations are most dependent on natural resources. In arid and semi-arid regions of the world, home to about 40% of the planet’s population, desertification processes are accelerating: annually, 12 million hectares of once-fertile land irreversibly turn into desert Land Degradation. This process is exacerbated by climate change, overgrazing, unsustainable agricultural practices, and deforestation.
Water Resource Pollution
Global Water Quality Crisis
Access to clean drinking water remains one of the most acute global problems: approximately 1.8 billion people worldwide—nearly a quarter of the planet’s population—are forced to use drinking water sources seriously contaminated with fecal pathogens. Of these, 1.1 billion people face “moderate” health risks, including high probability of contracting diarrheal diseases, cholera, dysentery, and other waterborne infections. The situation is particularly critical in rural areas of developing countries, where developed water treatment and sewage infrastructure is absent. Additionally, more than 154,000 square kilometers of territory, predominantly in densely populated regions of South and Southeast Asia, as well as some parts of Africa, have high probability of critical contamination of underground aquifers with natural arsenic in concentrations significantly exceeding World Health Organization safety recommendations (10 micrograms per liter) World Water Quality Assessment.
Positive Indicators
Ozone Layer Recovery
Thanks to the successful implementation of the 1987 Montreal Protocol, which became one of the most effective international environmental agreements in history, the planet’s ozone layer continues to show steady recovery. The global ban on production and use of ozone-depleting substances, such as CFCs and halons, led to significant reduction in their atmospheric concentration. The Antarctic ozone hole in 2024 was relatively small by historical standards and ranked seventh smallest since the active recovery period began in 1992 NASA, NOAA Rank 2024 Ozone Hole as 7th-Smallest Since Recovery Began. Scientists predict complete ozone layer recovery in mid-latitudes by 2040, in the Arctic by 2045, and over Antarctica by 2066. This success demonstrates that with political will and international cooperation, humanity can solve global environmental problems.
Renewable Energy Growth
In 2024, global renewable energy capacity demonstrated record growth of 15.1%, reaching an impressive 4,448 gigawatts of installed capacity, equivalent to approximately 4,400 large nuclear power plants. This growth occurred mainly through rapid development of solar photovoltaic and wind energy, which are becoming increasingly cost-competitive with traditional fossil fuel sources. Energy transition investments exceeded the historic milestone of $2 trillion USD for the first time in human history, surpassing the combined GDP of many countries Global Investment in the Energy Transition Exceeded $2 Trillion for the First Time in 2024. This massive capital influx accelerates development of more efficient energy storage technologies, smart electrical grids, and innovative solutions for storing excess renewable energy.
Ocean Cleanup Progress
The Ocean Cleanup, a non-governmental organization developing innovative technologies to remove plastic waste from marine environments, achieved outstanding results in 2024, removing a record 11.5 million kilograms of various debris from oceans and river systems. This impressive figure not only exceeds the total waste volume collected by the organization in all previous years of operation but also demonstrates the scalability of technological solutions for combating ocean pollution 2024: A record-breaking year for The Ocean Cleanup. The organization deployed autonomous waste collection systems in the Great Pacific Garbage Patch and installed innovative waste interceptors at the mouths of the world’s most polluted rivers, preventing waste from entering the ocean. Collected plastic is recycled into new products, creating a circular economy and financial sustainability for the project.
Conclusions
Record temperatures, catastrophic deforestation rates, widespread pollution, and mass species extinction require immediate and decisive action. The speed of natural system degradation still significantly outpaces efforts to protect and restore them.
Nevertheless, positive examples in ozone layer recovery, renewable energy growth, and ocean cleanup prove that coordinated international efforts, backed by science and technology, can yield real results. Preventing irreversible consequences and transitioning to a sustainable future requires fundamental systemic changes in the global economy, technology, agriculture, politics, and consumption patterns.
Sources:
- Indicators of Global Climate Change 2024 (2025)
- WMO confirms 2024 as warmest year on record at about 1.55°C above pre-industrial level (2025)
- Annual Carbon Dioxide Peak Passes Another Milestone (2025)
- Global Carbon Budget (2025)
- WMO Global Annual to Decadal Climate Update (2025)
- Fires Drove Record-breaking Tropical Forest Loss in 2024 (2025)
- Tropical forest loss hit new heights in 2024; fire a major driver in Latin America (2025)
- In one year, deforestation and conversion falls 30.6% in the Amazon (2025)
- Indonesia’s Primary Forest Loss slows in 2024 (2025)
- 100+ Plastic in the Ocean Statistics & Facts 2025 (2025)
- Goal 14: Conserve and sustainably use the oceans, seas and marine resources for sustainable development (2025)
- Living Planet Report 2024 (2024)
- IUCN Red List of Threatened Species Summary Statistics (2025)
- State of Global Air 2024 Report (2024)
- Soil Atlas (2015)
- Land Degradation (2018)
- World Water Quality Assessment (2021)
- NASA, NOAA Rank 2024 Ozone Hole as 7th-Smallest Since Recovery Began (2024)
- Global Investment in the Energy Transition Exceeded $2 Trillion for the First Time in 2024 (2025)
- 2024: A record-breaking year for The Ocean Cleanup (2025)
Related Topics

Capitalism
The price of your chocolate is child slavery. The world awaits its first trillionaire, while half of humanity struggles to survive. How did corruption, monopolies, and hidden slavery become the driving forces behind an economy that is destroying both the planet and you?
Problem list of Modern Society
A large and comprehensive catalog of systemic problems in modern society.

Resistance to science
An analysis of how society has resisted science and innovation throughout human history.

Why You Shouldn't Be Indifferent to Strangers?
Why indifference to others' thinking destroys civilization: the truth about how your beliefs affect the entire world.