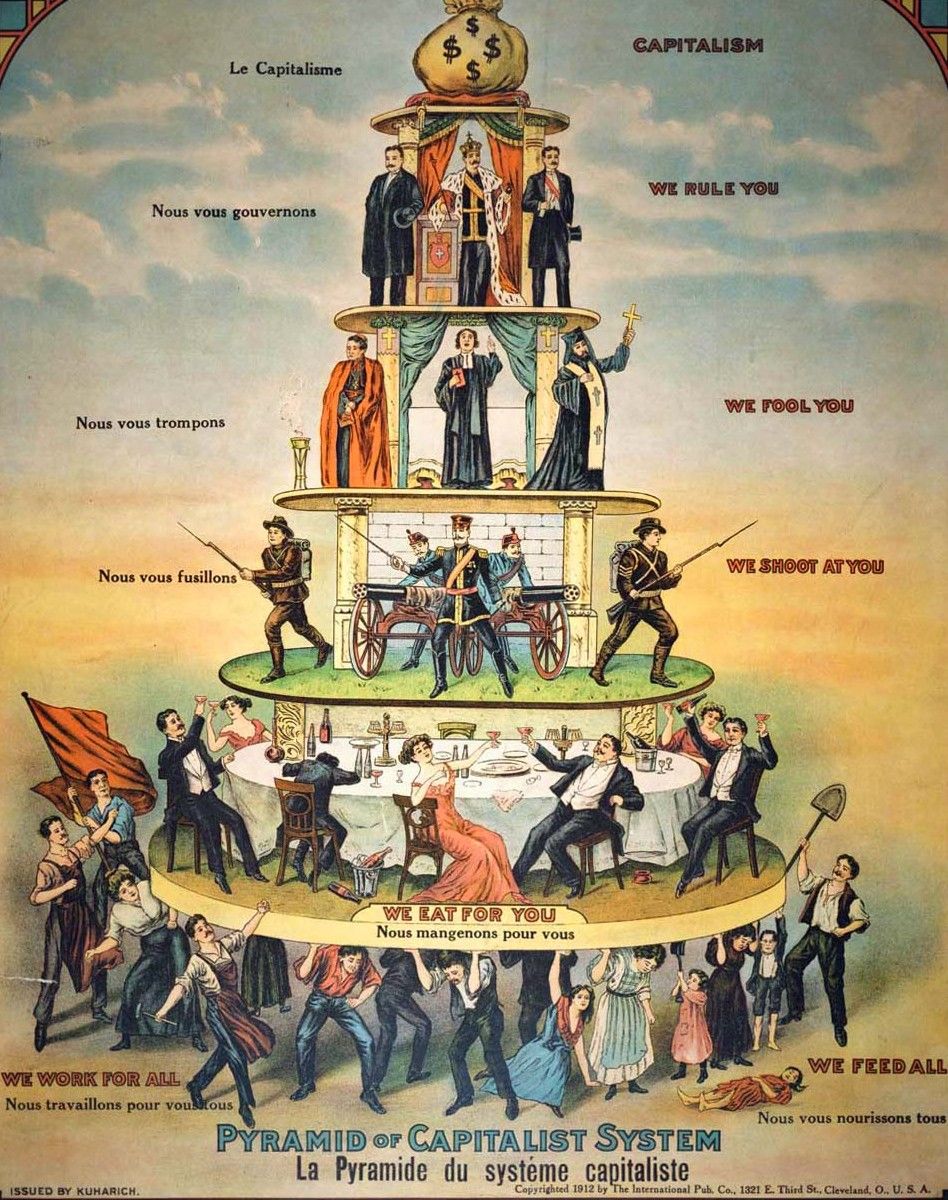
Capitalism
The price of your chocolate is child slavery. The world awaits its first trillionaire, while half of humanity struggles to survive. How did corruption, monopolies, and hidden slavery become the driving forces behind an economy that is destroying both the planet and you?

Capitalism: Systemic Problems and Their Consequences
Introduction
The modern economic system, based on capital and monetary relations, has reached unprecedented levels of production and technological development. In 2024, global GDP amounted to $111.3 trillion, and the value of the planet’s natural resources is estimated at $393 trillion. However, behind the facade of this abundance lie many systemic paradoxes and deep-rooted problems. This system, focused on endless growth and profit maximization, generates enormous social and economic inequality, leads to environmental destruction, sophisticated forms of human exploitation, and the introduction of ethically questionable business practices that directly harm society.
Theoretical Foundations and Methodology
Conceptual Approaches to Measuring Inequality
Traditional monetary approaches to measuring poverty (thresholds of $1.90-$6.85 per day) are supplemented by multidimensional indices that account for education, healthcare, living standards, and social participation. The Global Multidimensional Poverty Index (MPI) allows for a more accurate assessment of various manifestations of inequality in urban and rural settings, between genders, and across age groups.
For analyzing wealth concentration, indicators such as the share of the top-1%, top-10%, and top-0.1% of the population in total national wealth are used. Purchasing power is assessed through indices that consider both nominal incomes and the cost of living in different regions.
Socio-Psychological Mechanisms
Social identity theory vividly demonstrates how economic inequality becomes fertile ground for intergroup conflicts, the formation of persistent stereotypes, and the polarization of political attitudes. When the gap in incomes and wealth increases, economic classes (e.g., “rich” and “poor,” “1%” and “99%”) become more pronounced social categories. People begin to identify more strongly with their economic group (“us”) and contrast it with the other (“them”), which triggers key mechanisms of the theory:
-
Impact on Intergroup Relations: Growing inequality increases social distance. For example, studies in the USA and Europe show that in more unequal societies, the level of trust between people is lower. This manifests in residential segregation, school choice, and social circles, leading to weakened social ties and empathy between representatives of different economic strata.
-
Formation of Stereotypes: Inequality contributes to the creation and reinforcement of stereotypes that often serve to justify the existing order. According to the stereotype content model, the rich are often perceived as competent but cold and immoral, while the poor are seen as less competent but warmer and friendlier (or, in a negative light, as lazy). These stereotypes can directly influence behavior: for example, in hiring or evaluating someone’s abilities.
-
Formation of Political Attitudes: Economic inequality is a powerful driver of political processes. It can lead to increased demand for wealth redistribution (raising taxes on the rich, social programs) and fuel populist sentiments when politicians build their rhetoric on opposing “ordinary people” and the “corrupt elite.” A vivid example is the political polarization in the USA, where economic dividing lines largely coincide with party lines.
Fundamentally important for understanding these processes is the distinction between objective and subjective inequality:
-
Objective inequality — this is a statistical fact, measured by indicators such as the Gini coefficient or the share of national income belonging to the 1% richest people.
-
Subjective inequality — this is a person’s personal perception of the level of inequality in society. It is often a stronger predictor of social attitudes.
Perception can radically differ from statistics. For example, in countries with active media coverage of the lifestyles of the super-rich (through social networks, reality shows), the subjective sense of inequality can be very high, even if statistical indicators do not change. Studies show that it is subjective, not objective, inequality that is more strongly associated with personal happiness levels, demands for justice, and readiness for protests.
The impact of inequality also strongly depends on cultural context:
-
In the USA, where there is a strong belief in the “American Dream” and social mobility, inequality could long be perceived as a fair result of individual efforts. However, in recent decades, this view is changing.
-
In Scandinavian countries, with their egalitarian culture and strong social welfare institutions, even a slight increase in inequality can provoke a sharp public reaction.
-
In societies with low trust in state institutions (e.g., in some Latin American countries), high inequality more often leads to political instability and protests than in countries where citizens believe in the state’s ability to smooth economic gaps.
Historical Analysis: U-Shaped Trajectory of Inequality
The Gilded Age (1870-1900)
The first peak of wealth concentration occurred during the period of active industrialization. In the USA, the share of the top-1% of the population was 27-37% of all national wealth. In Massachusetts, the share of the top-5% grew from 57% to 70% between 1870 and 1900, demonstrating the rapid concentration of capital in the hands of the industrial elite.
Peak Inequality (1920-1930)
By 1928, the top-1% controlled 23.9% of all pre-tax incomes. In 1929, more than 60% of families earned less than $2000 per year, which was the minimum for meeting basic needs. This period was characterized by extreme inequality, which W.E.B. Du Bois described as “prosperity and depression side by side.”
The Great Depression and War Years (1930-1950)
The Great Depression was partly caused by enormous inequality between the rich (controlling a third of all wealth) and the poor (with no savings). The economic crisis and subsequent social reforms led to a sharp reduction in wealth concentration.
The Great Compression (1950-1970)
This period was characterized by the lowest level of inequality in American history. The share of the top-1% was 20-25% of all wealth. The growth of the middle class, strong unions, and a progressive tax system contributed to relative equality.
Return to High Inequality (1980-2024)
Since the 1980s, there has been a steady increase in wealth concentration. From 25-30% in 1980-2000, the indicator grew to 30.8% in 2024, approaching Gilded Age levels. The top-0.1% (ultra-rich) control 13.8% of all wealth, which in dollar terms amounts to $49.2 trillion.
Global Structure of Inequality
Wealth Concentration on a Global Scale
Global wealth concentration has reached historical highs: the top-1% in the world owns 43% of all global financial assets, and 69% of global wealth is concentrated in developed countries. In 2024, billionaires’ wealth grew by $2 trillion ($5.7 billion per day), while 2,769 billionaires control aggregate wealth of $15 trillion.
Regional Differences in Purchasing Power
Analysis of purchasing power by country reveals significant disparities. The leaders are:
-
Luxembourg (index 148.9)
-
Saudi Arabia (131.46)
-
USA (127.62)
-
Switzerland (126.15)
-
Qatar (125.05)
Russia ranks 51st with an index of 51.11, indicating average purchasing power, while China with an index of 72.28 shows higher indicators. Critically low purchasing power (index less than 50) is found in more than 40 countries, including Nigeria (9.4), Venezuela (12.6), and Egypt (15.2).
Multidimensional Analysis of Poverty
Global Poverty Statistics
Updated World Bank data for 2024 shows the scale of global poverty:
-
Extreme poverty (less than $2.15/day): 692 million people (8.5% of the population)
-
Moderate poverty (less than $3.65/day): 1.75 billion people (21.4% of the population)
-
Poverty by $6.85/day criterion: 3.56 billion people (43.6% of the population)
Regional Distribution of Poverty
Extreme poverty is concentrated in certain regions:
-
Sub-Saharan Africa: 60% of all extremely poor (416 million people)
-
South Asia: 30% of all extremely poor (208 million people)
-
Other regions: 10% of all extremely poor (69 million people)
Of particular concern is child poverty: about 50% of all extremely poor are children under 18, meaning 347 million children living in extreme poverty.
Demographic Aspects of Inequality
Gender Differences in Purchasing Power
The gender income gap widens with age. In the 18-24 age group, the gap is 2.2%, but by 55-64 years, it increases to 25.8%. Women aged 20-30 earn more than 80 cents for every dollar earned by men of the same age, but by 55-60 years, this figure drops to 74 cents.
Paradoxically, women make 85% of all consumer decisions and control $5-15 trillion in annual spending in the USA, yet globally earn about 15% less than men.
Age Features of Purchasing Power
Peak purchasing power is reached at ages 41-45, explained by achieving career heights and accumulating resources. Generation X demonstrates the highest purchasing power, spending an average of $83,357 per year per person.
Corruption as a Structural Factor of Inequality
Theoretical Mechanisms of the Interconnection Between Corruption and Inequality
Modern studies have revealed a fundamental interconnection between corruption and economic inequality, manifested through material and normative mechanisms.
Material mechanisms lie in the fact that wealthy strata of society have both greater motivation and more opportunities for participation in “elite corruption” (state capture). They can bribe officials to obtain favorable government contracts, tax benefits, and influence on legislation. A classic IMF study (Does Corruption Affect Income Inequality and Poverty?) showed that this type of corruption directly leads to increased inequality. At the same time, poor strata of the population more often face “petty corruption”, being vulnerable to extortion when seeking basic government services (medicine, education), which further depletes their resources.
Normative mechanisms are related to the fact that high inequality undermines the legitimacy of social and political institutions. When citizens see that the rules of the game are systematically violated in favor of the rich, their own commitment to the law weakens. A study (A Comparative Study of Inequality and Corruption), covering about 129 countries, confirmed that inequality is as powerful a predictor of corruption as commonly recognized factors like low economic development or weak democracy. It destroys social trust and creates an atmosphere where corruption becomes an acceptable norm of behavior.
The Vicious Circle of Corruption and Inequality
Corruption increases income inequality and poverty through several clearly established channels, creating a vicious circle where each factor reinforces the other.
-
Reduction in Economic Growth: Corruption deters investors, reduces the quality of government investments and infrastructure, and suppresses innovation. Seminal work (Corruption and Growth) in The Quarterly Journal of Economics empirically proved that countries with high levels of corruption exhibit lower economic growth rates and private investment volumes. This slowed growth primarily affects the poor.
-
Distortion of the Tax System: Corruption makes the tax system regressive. World Bank studies show that in corrupt countries, wealthy individuals and corporations use bribes and loopholes to evade taxes. This shifts the tax burden onto wage workers and small businesses, and the state underreceives funds for financing social programs.
-
Inefficiency of Social Spending: Funds allocated for poverty alleviation, healthcare, and social security are often embezzled. A study (Corruption and the Provision of Health Care and Education Services) showed that high corruption levels correlate with low health and education indicators, as money does not reach recipients due to “leakages” and “kickbacks” in government procurements of medicines or school construction.
-
Barriers in Education: Corruption creates deep inequality in access to quality education, which is the main social elevator. Bribes for admission to prestigious universities or buying diplomas deprive talented children from poor families of chances to build human capital, preserving poverty across generations.
-
Asset Concentration: Through corrupt privatization deals, opaque distribution of land and resources, assets are concentrated in the hands of a small group of people connected to power. This mechanism was particularly evident in post-Soviet countries in the 1990s and remains a key factor in ultra-high inequality in the region.
Impact of Corruption on Perception of Justice
Perception of justice plays a key role in this cycle. A study (All for All: Equality, Corruption, and Social Trust) shows that in countries with high inequality (where the system is initially perceived as unfair), corruption is seen as an inevitable evil. In these conditions, honest and impartial treatment from individual officials (procedural justice) has little impact on the overall opinion of the system’s corruptness. Conversely, in more egalitarian societies (e.g., Scandinavia), faith in the fairness of institutions significantly reduces tolerance for corruption and its perception.
This creates a dangerous feedback loop: inequality breeds corruption → corruption undermines faith in the fairness of institutions → low faith in fairness makes citizens more tolerant of corruption, as they believe “everyone does it.” At the micro level, this pushes individuals toward corrupt behavior, since honesty in a dishonest system seems irrational.
Regional Features of Corruption’s Impact
The impact of corruption on inequality varies. In Latin American countries with historically high inequality in land distribution (assets), corruption may not increase the already existing gap as much, but it catastrophically slows economic growth, preventing the poor from escaping poverty.
In Eastern European and Central Asian countries, where social differentiation is high and the practice of “state capture” is strong, corruption directly exacerbates inequality. World Bank analysis on Kazakhstan shows that while measures to combat the shadow economy and corruption can promote fairer income distribution, demographic factors (higher birth rates in poor families) can mask this effect in statistics, for example, in the Gini coefficient.
Blaming Corruption or the System? Rethinking the Role of Capitalism
Blaming corruption alone, ignoring systemic incentives, means seeing only the symptom, not the disease. The problem is not in capitalism as such, but in its specific unregulated models, which create an environment for rent-seeking behavior. This economic term describes the pursuit of profit not through creating new products or services, but through manipulating the political and legal environment (e.g., lobbying for monopoly rights, obtaining exclusive subsidies).
In models of “liberal market capitalism” (as in the USA), high inequality and powerful corporate lobbying create constant incentives for “state capture.” At the same time, “coordinated market economies” (as in Germany or Sweden) with their strong unions and traditions of social partnership have historically better contained both inequality and corruption.
Alfie Kohn’s book (Punished by Rewards) proves that external motivation (especially monetary) can displace internal, ethical motivation. This is confirmed in corruption studies. Economist (Dan Ariely)‘s works show that people are less likely to cheat due to social norms than due to small fines. However, when huge financial benefits are at stake — an incentive created by an unregulated market — moral considerations recede into the background. Thus, the problem is not in abstract “human greed,” but in a system that makes corrupt and unethical behavior a rational strategy for success.
Historical Evolution of Slavery: From Direct Coercion to Financialized Exploitation
Ancient Forms of Slavery: Ownership of People as Property
In the ancient world, slavery represented a direct form of owning a person as property. In Ancient Greece and Rome, slaves made up 30% to 40% of the population and were regarded as “speaking tools” (instrumentum vocale). The economic logic was simple: a person was bought, used as labor, and could be sold. The slave owner bore full responsibility for the slave’s maintenance, including food, housing, and medical care.
This system was relatively “open” in the sense that the slave’s status was obvious to all society. Slavery was not hidden — it was a legally enshrined foundation of the economy. Money in this system played the role of a simple medium of exchange in buying and selling people, but exploitation itself was carried out through direct physical coercion.
Feudal Serfdom: Land Dependence
The evolution from ancient feudalism to modern capitalism represents a transformative journey in socio-economic systems. Feudalism, a hierarchical agrarian system that dominated the Middle Ages, was characterized by land ownership and loyalty to lords. Serfdom became a more veiled form of coercion, where people were formally not property but were tied to the land and could not leave it without the feudal lord’s permission.
Economic relations were built not on direct buying and selling of people, but on control over land. Peasants worked corvée, paid quitrent, and various feudal dues. Money began to play a more complex role — not only as a medium of exchange but also as a way to measure and collect various payments and taxes.
Atlantic Slave Trade: Commercialization of Human Bodies
Transatlantic slavery and the rise of capitalist global economy demonstrate a two-stage evolution of the global economy — the rise of the capitalist Atlantic economic system of the 19th century (the core of the global economy) as the first stage, and the spread of this system to Asia and the rest of the world as the second stage.
The period of the 16th-19th centuries was marked by unprecedented commercialization of slavery. Market competition drove slave prices to the present value of the expected future income stream, discounted at prevailing interest rates. Average returns from slaves in the American South fluctuated between 8 and 10 percent, comparable to capital returns in the pre-war period.
In this period, a fundamental transformation occurred: slaves became not just labor but financial assets. They were used as collateral for loans, insured as property, and their future productivity was embedded in complex financial instruments. Slavery in America, Brazil, and Cuba relied on capitalist markets that provided credit and demand for goods produced by slave labor.
Industrial Slavery: Mechanization of Exploitation
The “whip” and “trade in human flesh” were particularly integral parts of New World capitalist exploitation. Marx explained that the history of civilization took its most “horrifying” forms where slavery combined with commercialism.
The 19th century brought the industrialization of slavery, especially on cotton plantations in the American South. Slave labor became an integral part of the emerging global capitalist system, supplying raw materials to textile factories in England and New England. Money turned into a universal language for measuring human value: slaves were valued, bought, sold, and pledged like any other capital asset.
Wage Slavery: Formal Freedom with Economic Coercion
After the formal abolition of slavery in the 19th century, new, more hidden forms of coercion emerged. The sharecropping system in the American South, debt bondage, indentured labor contracts created conditions where people were formally free but economically remained dependent, often more harshly than in classical slavery.
The key difference was that exploitation was now carried out through monetary mechanisms: debts, interest, unfair contracts, monopolistic pricing. The slave owner no longer bore responsibility for the worker’s maintenance — this obligation shifted to the worker themselves, making exploitation even more profitable.
Global Wage Slavery of the 20th-21st Centuries: Financialization of Coercion
Capitalism represents a transformation of slavery, where the division between slavery, feudalism, and capitalism was explicitly developed to describe class relations in ancient, medieval, and modern Europe respectively.
Modern forms of coercion have reached an unprecedented level of complexity and veiledness. Structural adjustment programs of the World Bank and IMF, debt crises in developing countries, transfer pricing by transnational corporations create conditions for mass exploitation without direct physical coercion.
Money has become not just a medium of exchange but a tool of global control. Through mechanisms of debt, currency manipulations, trade agreements, and financial sanctions, a system is created where entire countries and continents find themselves in economic dependence, reminiscent of slavery but legally framed as “free trade” and “market relations.”
Paradox of Increasing Hiddenness of Exploitation
The historical trajectory shows a paradoxical pattern: the more developed monetary relations become, the more hidden forms of coercion become. If ancient slavery was open and direct, modern forms of exploitation are masked as “market mechanisms,” “economic efficiency,” and “global competition.”
This process of “invisibilization” of slavery is closely linked to the development of financial instruments. The more complex monetary relations become, the harder it is to trace real wealth flows and identify exploitation mechanisms. Modern slavery does not need shackles — it uses credit lines, interest rates, exchange rates, and trade agreements.
Modern Slavery and Neocolonial Exploitation in Africa
Child Labor on Cocoa Plantations: The Case of Nestlé and Other Transnational Corporations
One of the most striking examples of modern slavery within the capitalist system is the exploitation of child labor on cocoa plantations in West Africa. In Côte d’Ivoire and Ghana, which together produce nearly 60% of the world’s cocoa, 1.56 million children are engaged in child labor on cocoa farms. Major corporations Mars, Nestlé, and Hershey promised nearly two decades ago to stop using cocoa harvested by children, yet most of the chocolate we buy is still produced using child labor.
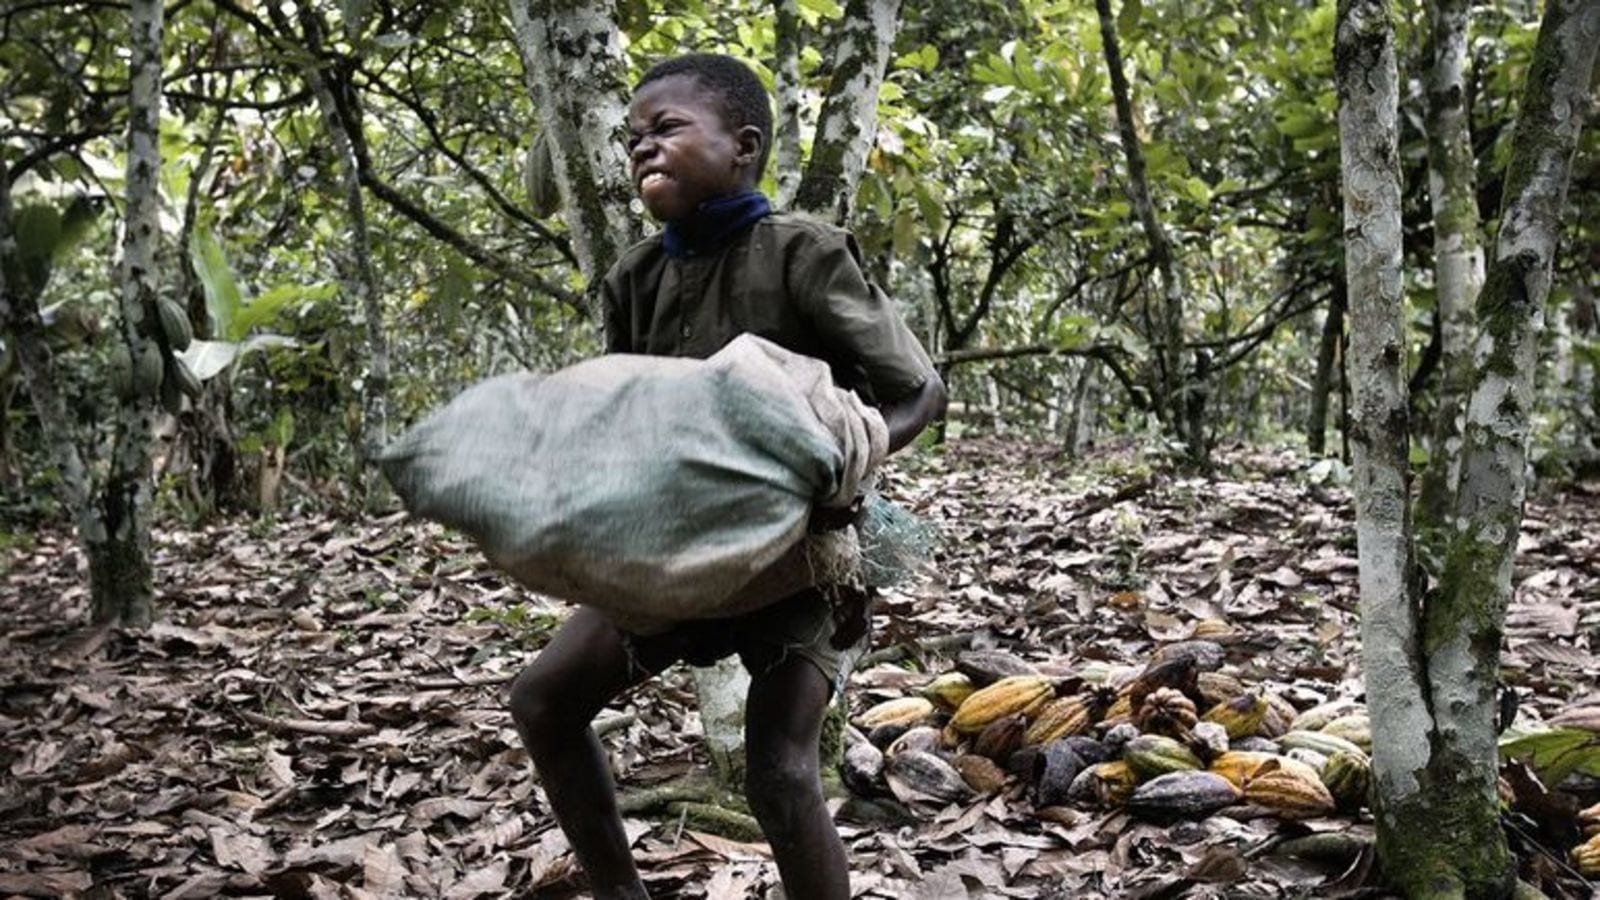
This system of exploitation demonstrates the fundamental contradictions of capitalism: transnational corporations reap multibillion-dollar profits from chocolate production, while at the base of their supply chains lies the labor of thousands of disadvantaged children on West African cocoa farms. Child labor has been found on cocoa farms in Cameroon, Guinea, Nigeria, and Sierra Leone, though most cases are documented in Ghana and Côte d’Ivoire.
Corporations use corporate social responsibility strategies to conceal the structural nature of the problem. Nestlé presents child labor as a local West African issue, occurring mainly on family farms, and claims to be trying to address it. However, such rhetoric masks the systemic nature of exploitation embedded in global value chains.
Paradox of Africa’s Resource Wealth: $6.5 Trillion in Natural Resources and Mass Poverty
The African continent represents one of the most striking examples of the “paradox of plenty” in the modern world economy (Africa’s Natural Resource Wealth: A Paradox of Plenty and Poverty). With natural resources worth $6.5 trillion, 65% of the world’s undeveloped arable land, and a young population, Africa has no excuse to be poor, notes the president of the African Development Bank. However, reality radically differs from this potential.
Africa, the world’s most resource-rich continent, holds 30% of global mineral reserves, yet many of its countries suffer from poverty, conflicts, and slow economic growth. Each year, $90 billion leaves Africa through illicit financial flows — funds that could transform healthcare and infrastructure. Meanwhile, about 282 million people remain undernourished, and more than half of the countries face a debt crisis.
This paradox is explained by the neocolonial structure of the world economy, where African countries remain suppliers of raw materials to transnational corporations, receiving a minimal share of added value. Large mining and oil companies extract resources, leaving local populations with environmental problems, destroyed infrastructure, and poverty.
Diversity of Forms of Modern Slavery Under Capitalism
The capitalist system creates conditions for various forms of forced labor and economic exploitation in Africa:
-
Debt Bondage on Agricultural Plantations: Farmers fall into debt dependence on intermediaries and corporations, unable to exit the cycle of exploitation.
-
Forced Labor in the Mining Industry: Extraction of cobalt, gold, diamonds, and other valuable resources is often based on exploitation of the local population, including children.
-
Labor Migration and Human Trafficking: Economic hopelessness forces people to agree to bonded labor conditions both within the continent and beyond.
-
Gender Exploitation: Women and girls are particularly vulnerable to various forms of coercion in conditions of economic instability.
These forms of modern slavery are not relics of the past but an integral part of the modern capitalist system, where profit maximization is achieved at the expense of extreme exploitation of the most vulnerable groups.
Neocolonial Mechanisms of Wealth Extraction
Modern exploitation of Africa is carried out through more sophisticated mechanisms than direct colonial rule:
-
Unfair Trade Terms: African countries export raw materials at low prices and import finished goods at high prices.
-
Debt Dependence: External debt exceeds $1 trillion, creating conditions for economic coercion.
-
Tax Havens and Transfer Pricing: Transnational corporations minimize taxes in African jurisdictions.
-
Land Grabbing: Foreign investors acquire large tracts of fertile land for export production.
This represents the greatest paradox: the most resource-rich continent has the poorest countries on earth. Dependency theories emphasize the disadvantaged position of developing countries with natural resource abundance in the world system.
Environmental Damage: An Inevitable Consequence of Capitalism
Along with social inequality and exploitation, capitalism inflicts colossal harm on the planet’s ecology. This damage is not a random side effect but a direct consequence of the system’s fundamental principles, oriented toward profit maximization and endless growth.
Logic of Externalization: Shifting Costs to Nature and Society
A central element of capitalist economy is externalization of costs. This is the process by which corporations minimize their expenses by shifting the negative consequences of their activities onto society and the environment. Air and water pollution, deforestation, greenhouse gas emissions, formation of toxic waste — all these are “external costs” not accounted for in companies’ financial reports but paid for by all humanity. Such a system creates a vicious incentive: the more environmental damage a company can shift to others, the higher its profit.
Imperative of Endless Growth on a Finite Planet
The capitalist system requires constant economic growth. Stagnation or decline is viewed as a crisis. This “growth imperative” forces the production and consumption of more goods and services, inevitably leading to depletion of non-renewable natural resources and exceeding the planet’s capacity for self-recovery. The idea of endless growth on a planet with finite resources is a fundamental contradiction that leads to ecosystem degradation, loss of biodiversity, and climate crisis.
Climate Crisis as the Greatest Market Failure
Climate change is the most vivid and dangerous example of externalization. For decades, fossil fuel-based industries have reaped trillion-dollar profits, while costs in the form of global warming, extreme weather events, and sea-level rise have been shifted to future generations and the most vulnerable populations. The climate crisis is not just a technical problem but a structural failure of the market system, which is unable to value and protect the fundamental bases of life on Earth.
Commodification of Nature: Turning Ecosystems into Commodities
Within capitalism, nature is viewed not as a complex system supporting life but as a set of resources (commodities) subject to exploitation. Forests turn into timber, rivers into hydropower sources, and land into assets for speculation. This utilitarian approach ignores the intrinsic value of nature and vital “ecosystem services” (such as pollination, water purification, and climate regulation), leading to their destruction since they have no direct market price.
Thus, the environmental crisis is closely intertwined with the logic of capitalism. The systemic pursuit of profit at the expense of externalizing costs and the requirement of endless growth make capitalism fundamentally incompatible with environmental sustainability.
The Great Pacific Garbage Patch: A Monument to the Culture of Single-Use
One of the most vivid and depressing symbols of capitalism’s environmental damage is the Great Pacific Garbage Patch. This is not an island in the literal sense but a gigantic accumulation of plastic waste held by ocean currents. Its area, by various estimates, is three times the size of France.
This garbage patch is a direct consequence of several key aspects of the system:
-
Culture of Single-Use: Production of cheap single-use plastic items (packaging, bottles, utensils) is extremely profitable since it stimulates constant consumption. Responsibility for disposal is shifted to the consumer and the state.
-
Externalization of Costs: The cost of collection, recycling, and disposal of waste is not included in the product price. The ocean becomes a free dump, and costs in the form of pollution, death of marine animals, and microplastics entering the food chain are borne by ecosystems and all humanity.
-
Globalization of Production: Goods are produced in one part of the world, consumed in another, and waste ends up in a third, creating a complex and opaque chain of responsibility where it is nearly impossible to find the guilty.
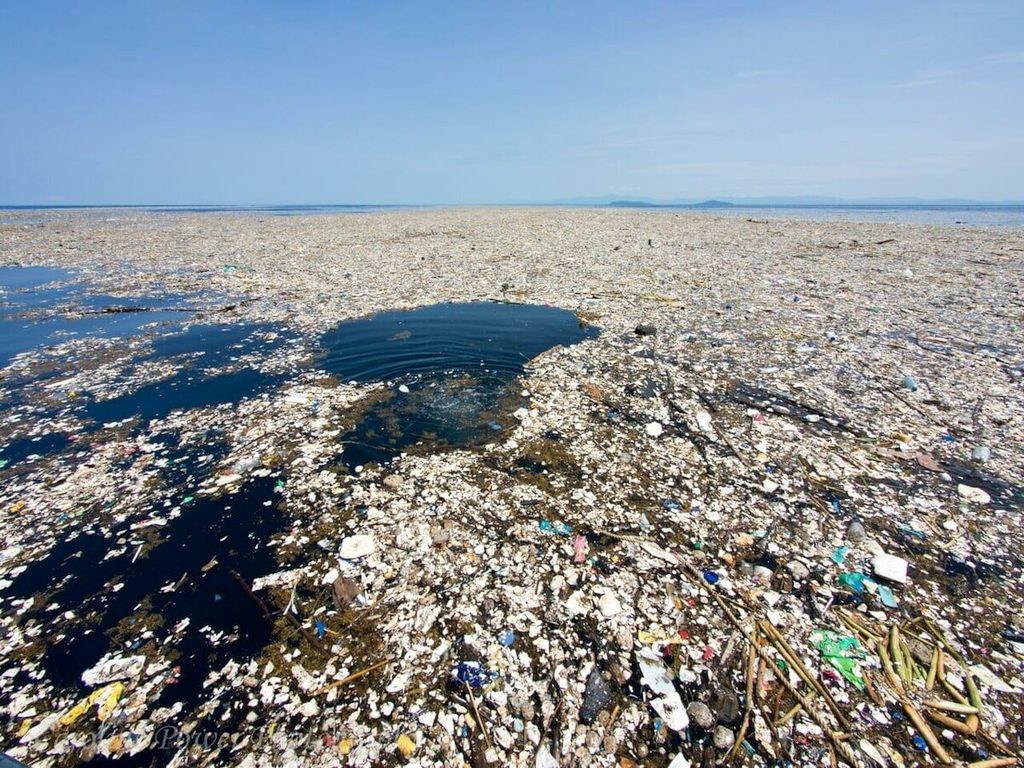
The Great Pacific Garbage Patch is a physical embodiment of the market system’s failures: it vividly demonstrates how the pursuit of short-term profit from single-use goods creates a long-term environmental catastrophe on a planetary scale. Thus, the environmental crisis is closely intertwined with the logic of capitalism.
Profit at Any Cost: Planned Obsolescence and Harm to Society
The pursuit of profit maximization in the capitalist system generates business models that directly harm consumers, society, and the environment. These practices are not exceptions but logical extensions of a system where financial results are placed above well-being. Scientific studies increasingly document the systemic nature of this phenomenon and its destructive consequences.
Planned Obsolescence: Engine of Wastefulness
Planned obsolescence is a deliberate strategy of designing products with an artificially limited lifespan to force consumers to make repeat purchases. A bibliometric analysis of academic literature from 1967 to 2024 shows that this practice significantly affects consumer spending, waste generation, and supply chain management (Planned Obsolescence: Bibliometric Analysis from 1967 to 2024). This is achieved in various ways:
-
Technological Obsolescence: Releasing new models that make old ones incompatible or non-functional. A classic example is software updates for smartphones that slow down older devices, pushing for new purchases. Apple’s “Batterygate” became a textbook case: the company admitted to slowing iPhones with old batteries (Apple battery lawsuit: Millions of iPhone users could get payouts in legal action). Research showed that when software was updated, performance of old devices dropped to 58%. Apple eventually agreed to pay $113 million to settle lawsuits from more than 30 US states. Analysis showed that such practices potentially increased iPhone sales by millions of units per year.
-
Constructive Obsolescence: Using low-quality or short-lived components that are guaranteed to fail after a certain period. Studies show that in medical devices, for example, component obsolescence can halt production, delay critical patient treatment, and require costly redesigns with regulatory approvals (How to Prevent Component Obsolescence From Becoming Serious Medical Device Obsolescence Risks). The inability to replace batteries in most modern gadgets or using plastic gears instead of metal in household appliances are vivid examples of this strategy.
-
Psychological Obsolescence: Aggressive marketing and trend creation that convince consumers their things are “out of fashion” and need replacement. The “fast fashion” industry is the apex of this model. Studies show that ultra-fast fashion is characterized by even faster production cycles and fleeting trends (Ultra-fast fashion is a disturbing trend undermining efforts to make the whole industry more sustainable). For example, Chinese online retailer Shein adds about 6,000 new styles to its site every day. The average American consumer discards 81.5 pounds of clothing annually, and the number of times clothing is worn has decreased by about 36% over 15 years. 92 million tons of textile waste is produced each year, equivalent to a truck full of clothes going to landfills every second (10 Concerning Fast Fashion Waste Statistics).
The consequences of this practice are destructive: depletion of natural resources, gigantic volumes of electronic and industrial waste, and constant financial pressure on consumers forced to participate in an endless consumption race. Research showed that if the trend continues, the amount of fast fashion waste will grow to 134 million tons per year by the end of the decade.
Other Examples of Systemic Harm for Profit
In addition to planned obsolescence, there are many other sectors where the pursuit of profit leads to catastrophic social consequences:
-
Pharmaceutical Industry: The opioid crisis in the USA is the starkest example of how pharmaceutical companies employ strategies similar to planned obsolescence. University of Washington research showed that Purdue Pharma spent unprecedented amounts promoting OxyContin — 6-12 times more than on competing drugs (The Promotion and Marketing of OxyContin: Commercial Triumph, Public Health Tragedy). From 1996 to 2001, sales grew from $48 million to nearly $1.1 billion.
The company used deceptive marketing, claiming OxyContin was less addictive than other opioids. In 2001, Purdue spent $200 million on marketing alone, including holding over 40 national pain management conferences at resorts, where more than 5,000 doctors, pharmacists, and nurses received company-funded training. Purdue’s own 1995 testing showed that 68% of oxycodone could be extracted from an OxyContin pill when crushed, making the drug easily abusable.
Studies show that the pharmaceutical industry often focuses on creating drugs for chronic conditions that patients must take for life, ensuring stable income (The high cost of prescription drugs: causes and solutions). Stanford-Lancet Commission research showed that without urgent intervention, 1.2 million people in the USA and Canada will die from opioid overdoses by the end of the decade (What led to the opioid crisis—and how to fix it).
-
Food Industry: A meta-analysis of 45 studies covering nearly 10 million people showed that high consumption of ultra-processed foods is associated with 71% of 45 studied adverse health outcomes (Ultra-processed food exposure and adverse health outcomes: umbrella review of epidemiological meta-analyses). Consumption of such foods increases obesity risk by 55%, sleep disturbances by 41%, and death risk from cardiovascular diseases by 50% (Ultraprocessed foods linked to heart disease, diabetes, mental disorders and early death, study finds).
Studies show that food companies use marketing strategies similar to the tobacco industry. Documents reveal that tobacco conglomerates that bought beverage companies transferred their methods of attracting children as future smokers to sugary drinks, using colors, flavors, and marketing techniques (Tobacco industry involvement in children’s sugary drinks market, Tobacco companies hook kids on sugary drinks). International food policy research showed that on average, adults are exposed to 0.5 (UK) to 2.3 (Mexico) unhealthy food marketing strategies (Adults’ Exposure to Unhealthy Food and Beverage Marketing: A Multi-Country Study in Australia, Canada, Mexico, the United Kingdom, and the United States).
These examples show that in a system where profit is the main measure of success, harming society can become not just a side effect but a quite rational and successful business strategy. Studies consistently document these patterns and their systemic impact on public health, the environment, and social stability. Of course, here is the corrected version of the text with all sources returned in the format you specified.
How the Inequality Machine Works: From Assets to Psychology
1. Where Do Different Social Strata Keep Their Money?
There is a fundamental difference in how the rich and the middle class multiply their funds. This can be compared to two different ladders to prosperity.
-
The Middle Class Ladder — Real Estate. Most people in this group invest their main savings in their own housing. When house and apartment prices rise, their well-being increases.
-
The Rich Ladder — Stocks and Business. Wealthy people concentrate their assets in the stock market and shares of private companies. According to the US Federal Reserve, the top 10% of the population owns 84% of all stocks in the country (compared to 77% in 2001) (Distributional Financial Accounts, Federal Reserve).
This gap creates a “swing effect”: when the stock market booms, the rich become disproportionately richer, while rising real estate prices provide more modest support to the middle class. Studies confirm that it is stock income that causes the largest and sharpest spikes in inequality levels (Asset Prices and Wealth Inequality, NBER). Moreover, if the income gap continues to grow, it could artificially “inflate” asset prices by another 12%, making them even less accessible to others (Inequality and Asset Prices, NBER).
2. Market Capture and the Era of Heirs
Where does enormous wealth come from today? Increasingly — not from innovations, but from much older sources.
-
Inheritance and Monopolies. Oxfam analysts calculated that nearly 60% of billionaires’ fortunes are created through inheritance, market monopoly, or connections to power. In 2024, a landmark moment occurred: for the first time since 2009, every new billionaire under 30 inherited their wealth. This signals the beginning of the “great wealth transfer” from one generation of the super-rich to another (Inequality Inc., Oxfam International).
-
Monopoly Power. About 18% of global billionaire wealth comes from control over entire industries. These “monopoly magnates” lead corporations that dictate the rules of the game, set inflated prices for consumers, and suppress competitors.
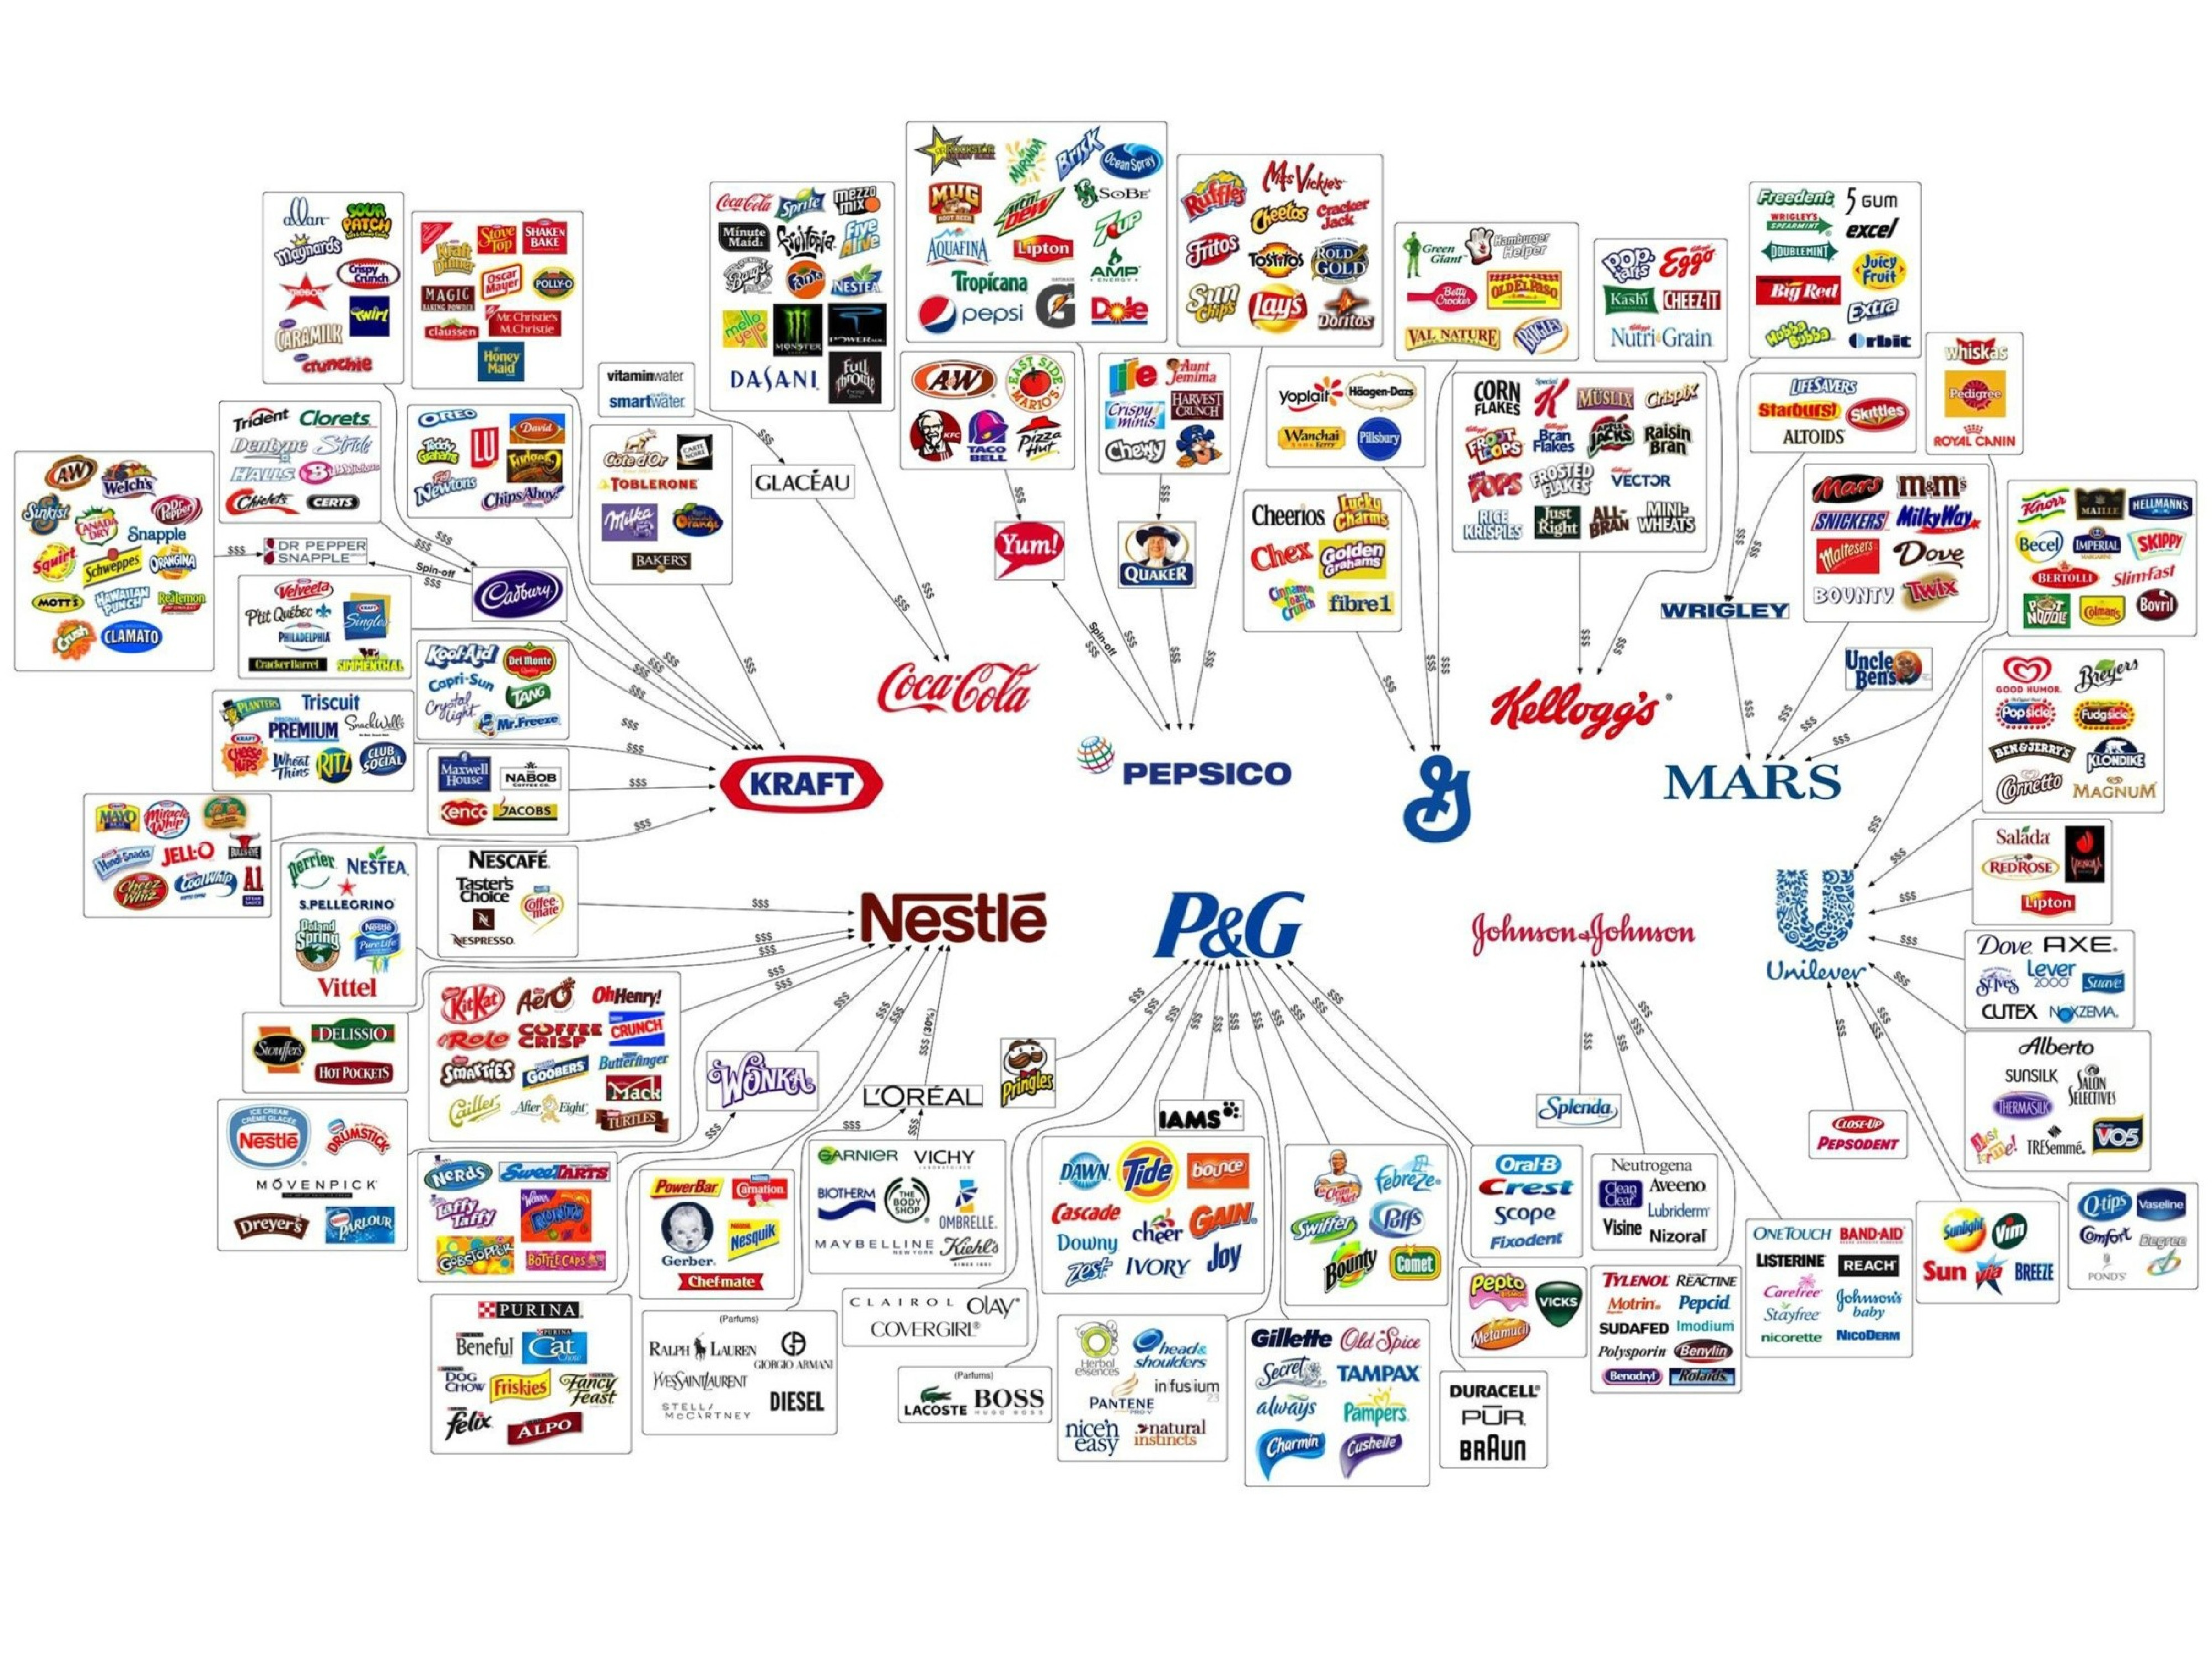
Corruption here acts as a catalyst. It allows companies to gain exclusive privileges, create barriers for competitors, and form monopolies, leading to concentration of wealth and power in the hands of a narrow elite.
3. Inequality in Minds: How Income Gaps Change Society
Economic gaps are not just numbers. They deeply affect society’s psychology and our relationships with each other.
-
Destruction of Unity. When inequality grows, people’s sense of belonging to their nation weakens, and identification with narrower groups, such as ethnic or social, strengthens. This creates a society divided into “us” and “them,” opening the way for authoritarian leaders who play on these contradictions (Inequality and Social Identity, Cambridge University Press).
-
Decline in Trust. Studies based on panel data from different countries unambiguously show: the higher the income inequality, the lower the level of trust between people. This effect is particularly strong in developed countries (Inequality and trust: new evidence from panel data, VOX EU). We stop believing we live in a society with uniform and fair rules for all. Researchers note that trust is influenced not only by the current income gap (Gini coefficient) but also by dynamic inequality — low chances for children to exceed their parents’ income (low social mobility).
Corruption exacerbates this process, breeding cynicism and a sense of total injustice. When bribes and nepotism become the norm, it finally destroys trust in state and public institutions (Who are Your Joneses? Socio-Specific Income Inequality and Trust, GLO Discussion Paper).
4. Natural Treasures Bringing Misfortune (“Resource Curse”)
Paradoxically, countries rich in oil, gas, or diamonds often suffer from slow growth and monstrous inequality. This phenomenon is called the “resource curse.” Causes — weak governance, lack of economic diversification, and dependence on world commodity prices (The Political Economy of the Resource Curse, World Bank).
Recent studies show that the key to solving this problem is economic complexity. Countries that not only extract resources but develop complex production chains based on them (e.g., petrochemicals) can turn the “curse” into a blessing and reduce inequality (Natural resources and income inequality: economic complexity is the key, Springer). Thus, sustainable development programs aimed at reducing dependence on raw material exports reduce the urban-rural income gap by an average of 4.11%, with the greatest effect observed where institutions were initially weakest (Does resource dependence reduction mitigate income inequality?, ScienceDirect).
Corruption is the main mechanism of the “resource curse”. It allows elites to direct revenues from selling national wealth into their own pockets instead of investing in medicine, education, and infrastructure.
5. Drivers of Inequality: Technology and “Money Out of Thin Air”
Key factors in modern inequality are globalization, automation, and central bank policies. Particularly notable is so-called quantitative easing (QE) — essentially, “printing money” by central banks to stimulate the economy.
Studies show that this policy has a dual effect. On one hand, it lowers interest rates and raises stock prices, disproportionately enriching already wealthy asset holders (Does Quantitative Easing Affect Inequality: Evidence from the US, Brookings). On the other hand, according to the European Central Bank, QE helps contain unemployment, providing jobs to many low-income people and thereby compressing inequality (How does monetary policy affect income and wealth inequality?, ECB).
The final result depends on institutional context. In countries with liberal market economies (like the USA), financial sector growth more strongly increases inequality. In countries with coordinated economies (like Germany), where the role of the state and unions is higher, this effect is almost absent (Financialization and inequality in coordinated and liberal market economies, LSE).
Corruption in the financial sector can distort even well-intentioned monetary policy, directing cheap credit not to economic development but into the hands of groups connected to power.
6. Forecasts: A World of Trillionaires and Stagnation in Poverty Fight
If current trends persist, a grim future awaits us:
-
The world will see its first trillionaire within the next decade. In 2024, billionaires’ wealth grew at a rate of $5.7 billion per day.
-
The fight against poverty has reached a deadlock. The number of people living in extreme poverty has barely changed since 1990. At current rates, eradicating poverty (by the $6.85 per day criterion) could take over a hundred years (Inequality Inc., Oxfam International).
Regional trends only highlight this gap. North America has the highest average wealth per adult ($593,347), and in the EU, billionaire wealth grew by 138 billion euros last year. Meanwhile, in the European Union, 74% of billionaires’ fortunes are inherited or created through monopolies and connections to power (Europe’s new age of monopoly, Oxfam EU). These figures are not accidental but a direct reflection of transparency levels and the effectiveness of anti-corruption efforts in different regions.
7. What to Do? From Taxes to Reforms
Fighting inequality requires comprehensive solutions:
-
Fair Taxes and Smart Investments. It is necessary to introduce progressive taxation of income from natural resource use and direct these funds to education, healthcare, and infrastructure. Studies show that even in authoritarian regimes, the presence of several competing parties and strong state institutions lead to lower inequality levels (Income inequality in authoritarian regimes, Taylor & Francis Online).
-
Financial Sector Reforms. Central bank policies must consider their impact on different strata of the population. It is important to implement rules that make the financial system more resilient and prevent it from working only in the interests of a narrow group.
Ultimately, fighting corruption must become the central element of any strategy to reduce inequality. Strengthening laws, transparency in public spending, and public control are not just technical measures but necessary conditions for building a fairer and more prosperous society.
Cost of Maintaining Prisoners and Comparison with High-Living-Standard Countries
Economic Costs of Maintaining Prisoners
The cost of maintaining one adult prisoner in prison varies depending on the country and conditions. In the USA, the average cost of maintaining a prisoner is about $40,000 per year. This amount includes expenses for food, housing, medical care, and security. Meanwhile, in Norway, a country with a high standard of living and known for its humane prison conditions, the cost of maintaining one prisoner reaches about $100,000 per year. The high cost in Norway is associated with providing better living conditions, which contributes to prisoner rehabilitation and reduced recidivism rates.
Comparison of Prisoner Numbers
The number of prisoners also differs significantly. The USA has about 2.2 million prisoners, which is roughly 670 prisoners per 100,000 people. In Norway, on the other hand, there are about 3,800 prisoners, corresponding to roughly 75 prisoners per 100,000 people. These data indicate that countries with high living standards, such as Norway, have significantly fewer prisoners per capita, which may be related to a more effective justice system, emphasis on rehabilitation, and crime prevention.
Economic and Social Aspects
The high cost of maintaining prisoners in Norway is offset by lower recidivism rates and better integration of former prisoners into society. In the USA, conversely, high costs for maintaining a large number of prisoners do not always lead to reduced crime, underscoring the need for reforms in the justice and penitentiary systems. Thus, investments in improving conditions and rehabilitation programs can be economically justified in the long term, contributing to reduced crime and social costs.
Conclusion
The modern economic system, built on the priority of monetary profit, demonstrates a series of deep and interconnected pathologies. These are not isolated failures but systemic characteristics stemming from its fundamental logic. We see how this system simultaneously generates extreme forms of social inequality, returning us to the “Gilded Age”; leads to irreversible environmental damage due to the imperative of endless growth on a finite planet; legitimizes practices harmful to society, such as planned obsolescence and promotion of addictive products; and perpetuates modern forms of exploitation, hidden behind complex financial and logistical chains.
Historical analysis shows that the current state of affairs is not inevitable. Periods of relative equality and social stability were the result of conscious political and institutional choices. However, today we face a powerful vicious circle where economic inequality, corruption, and environmental degradation mutually reinforce each other. Overcoming these challenges requires not just cosmetic reforms but a fundamental rethinking of the goals and values of our economic model — a transition from a system oriented solely on profit to one centered on human well-being and planetary health.
Sources:
- Gupta, S., Davoodi, H., & Alonso-Terme, R. (2002). Does Corruption Affect Income Inequality and Poverty? SSRN. https://papers.ssrn.com/sol3/papers.cfm?abstract_id=879858
- You, J. S., & Khagram, S. (2004). A Comparative Study of Inequality and Corruption. SSRN. https://papers.ssrn.com/sol3/papers.cfm?abstract_id=489823
- Mauro, P. (1995). Corruption and Growth. The Quarterly Journal of Economics. https://academic.oup.com/qje/article-abstract/110/3/681/1859244
- Uslaner, E. M., & Rothstein, B. (2005). All for All: Equality, Corruption, and Social Trust. SSRN. https://papers.ssrn.com/sol3/papers.cfm?abstract_id=824506
- Kohn, A. Punished by Rewards. Alfie Kohn. https://www.alfiekohn.org/punished-rewards/
- Mazar, N., Amir, O., & Ariely, D. (2008). The Dishonesty of Honest People: A Theory of Self-Concept Maintenance. Journal of Marketing Research. https://people.duke.edu/~dandan/webfiles/PapersPI/Dishonesty%20of%20Honest%20People.pdf
- Whoriskey, P., & Siegel, R. (2019). Cocoa’s child laborers. The Washington Post. https://www.washingtonpost.com/graphics/2019/business/hershey-nestle-mars-chocolate-child-labor-west-africa/
- Appiah, E. N. (2019). Africa’s Natural Resource Wealth: A Paradox of Plenty and Poverty. American Scientific Research Journal for Engineering, Technology, and Sciences. https://journals.scholarpublishing.org/index.php/ASSRJ/article/view/6814
- International Monetary Fund. (2024). World Economic Outlook. https://www.imf.org/en/Publications/WEO
- World Inequality Database. (2024). Global Inequality Data. https://wid.world/
- The World Bank. (2024). Poverty and Inequality Platform. https://pip.worldbank.org/
- Oxfam International. (2024). Inequality Inc. https://www.oxfam.org/en/research-reports/inequality-inc
- Numbeo. (2024). Purchasing Power Index by Country. https://www.numbeo.com/cost-of-living/rankings_by_country.jsp?title=2024&displayColumn=5
- Costanza, R. et al. (2014). Changes in the global value of ecosystem services. Global Environmental Change. https://www.sciencedirect.com/science/article/pii/S095937801400083X (Note: the figure of $393 trillion is a modern extrapolation and estimate based on methodologies presented in similar studies).
- United Nations Development Programme. (2023). Global Multidimensional Poverty Index. https://hdr.undp.org/content/2023-global-multidimensional-poverty-index-mpi
- Piketty, T. (2014). Capital in the Twenty-First Century. Harvard University Press.
Related Topics
Problem list of Modern Society
A large and comprehensive catalog of systemic problems in modern society.

Resource-based economy
About an alternative to the established economic system, which creates artificial shortages, limits human potential, and destroys the planet's ecology.

Resistance to science
An analysis of how society has resisted science and innovation throughout human history.